A web app that uses the USDE College Scorecard API to show information on various colleges.

At my first hackathon, one of the categories list was the Artis Sponsorship category. This category required the use of the US Department of Education’s College Scorecard API that contains a large amount of data on every college in the United States.
As high school freshman, my teammate and I saw the need for students like us to more easily discover different universities that are not as well known and get quick information on them. So, we opted to enter the sponsored category and create an app that gathers data from schools that match a user’s search query.
The primary function of this app is to provide information on a school that the user searches for. When you first make a query, the app shows a list of cards with details of a matching school on each card. It gives quick statistics like the size, location, tuition, and acceptance rate in the main card. Once you click the 3 dots on the bottom for more information, you get a more detailed breakdown of information for that school. This includes test averages, the school’s demographics, and more.
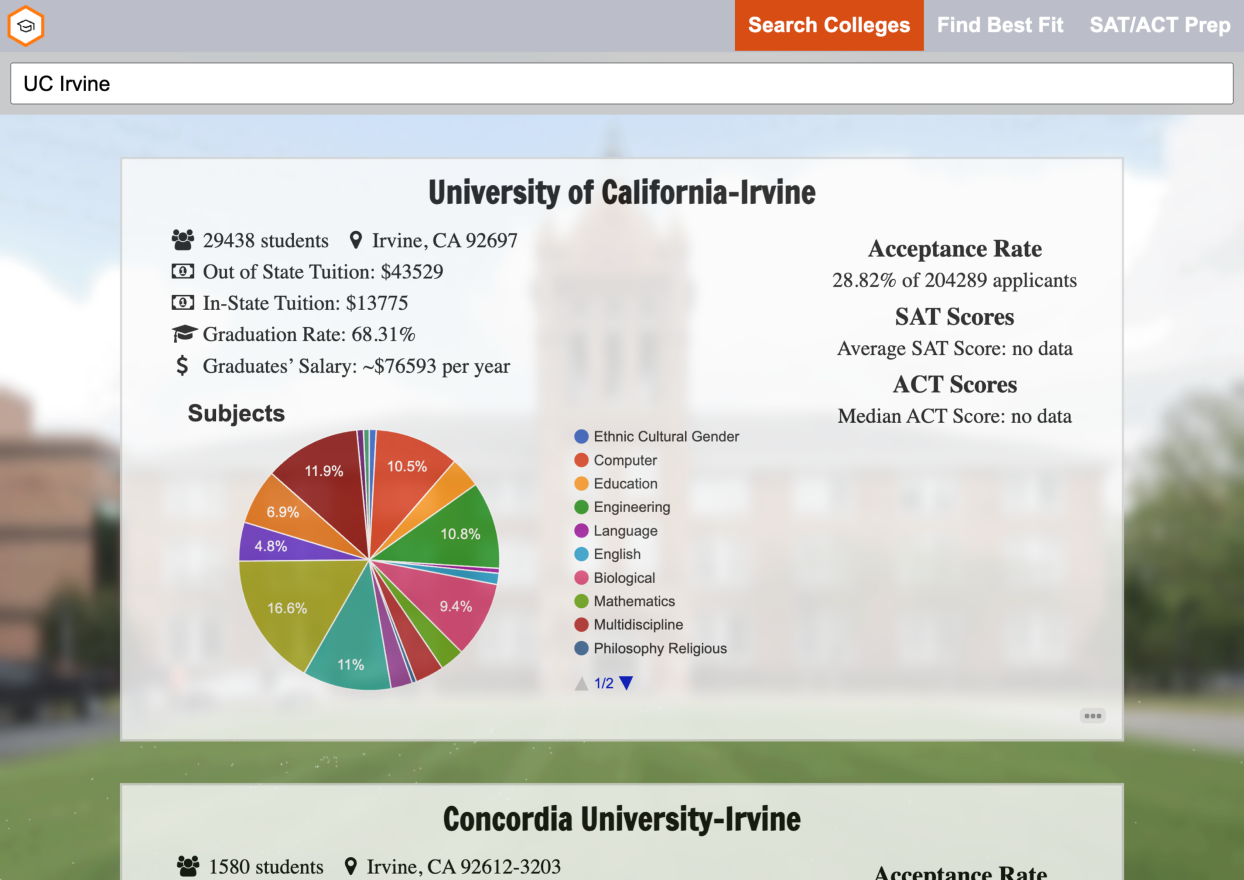
Search results showing basic stats for a school
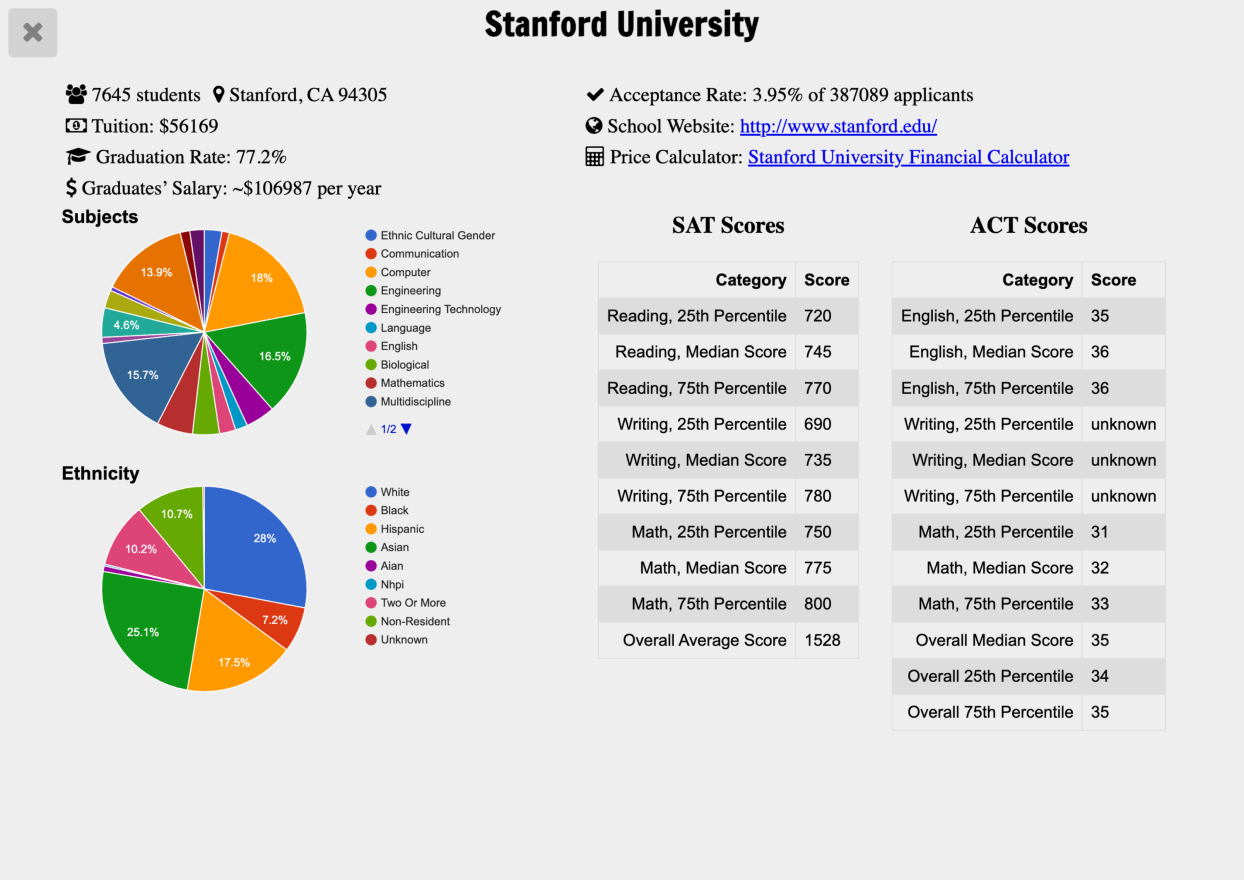
A more detailed breakdown of statistics
This app also provides a list of prep material for standardized tests, and it lets you search for a set of schools based on certain criteria. While we wanted to make it determine what school is a good fit for someone, it was something that would require more personality-based questions and was out of scope for this hackathon due to the API and the tight time constraint of 24 hours. Note: some functionality is now broken because the USDE College Scorecard API has been changed since I created this project.
This web app was built using HTML, CSS, and JavaScript. The layouts are created with HTML and CSS, and I use JavaScript to fetch data from the USDE College Scorecard API. This data is then put into cards for each school, and additionally, I made use of the Google Charts Library to provide visuals for what subjects and demographics each school had.
At the time, I was relatively new to coding dynamic web apps, but I had created a page that dynamically shows Hopscotch projects two months prior to this hackathon. Because that made me familiar with calling an API, traversing through JSON, and rendering content, I was able to apply that newly learned skill in this hackathon to create this project.